Greyhound Form Analysis for Kinsley Races: A Punter’s Method
Pattern Recognition, Not Mysticism
Form analysis isn’t mysticism — it’s pattern recognition applied to a very specific data set. Every greyhound race at Kinsley generates a body of data: finishing positions, times, sectional splits, race comments, grades, weights, trap draws. That data is publicly available on every racecard and every results page. The difference between the punter who uses it profitably and the one who doesn’t is not access to information — it is method.
The word “method” matters here because it implies consistency. A profitable approach to Kinsley form analysis is not about having a single brilliant insight once a month. It is about applying the same structured process to every race, every card, every meeting, and trusting that a disciplined evaluation of the data will produce better selections over time than instinct or habit. The data does not guarantee winners. No method does. But it shifts the odds of finding value in your favour, and at a track like Kinsley — where the favourite loses roughly seven times out of ten in graded races — finding value is the only sustainable basis for profit.
This guide sets out a practical form analysis method for Kinsley races. It covers time analysis, positional form, grade context, and the hidden signals in the form book that most punters either miss or misinterpret. It is not a theoretical framework. It is a working approach designed to be applied to actual racecards at actual meetings, and every principle in it has been shaped by the specific characteristics of this track — its distances, its grading system, its competitive patterns, and the tendencies of the dogs that race here week after week.
If you have read the racecard guide and the track guide in this series, you already know how to read the data and understand the venue. This is where you learn what to do with both.
Master form analysis at Kinsley on the kinsleydogresults homepage.
Time Analysis: The Metric That Cannot Lie
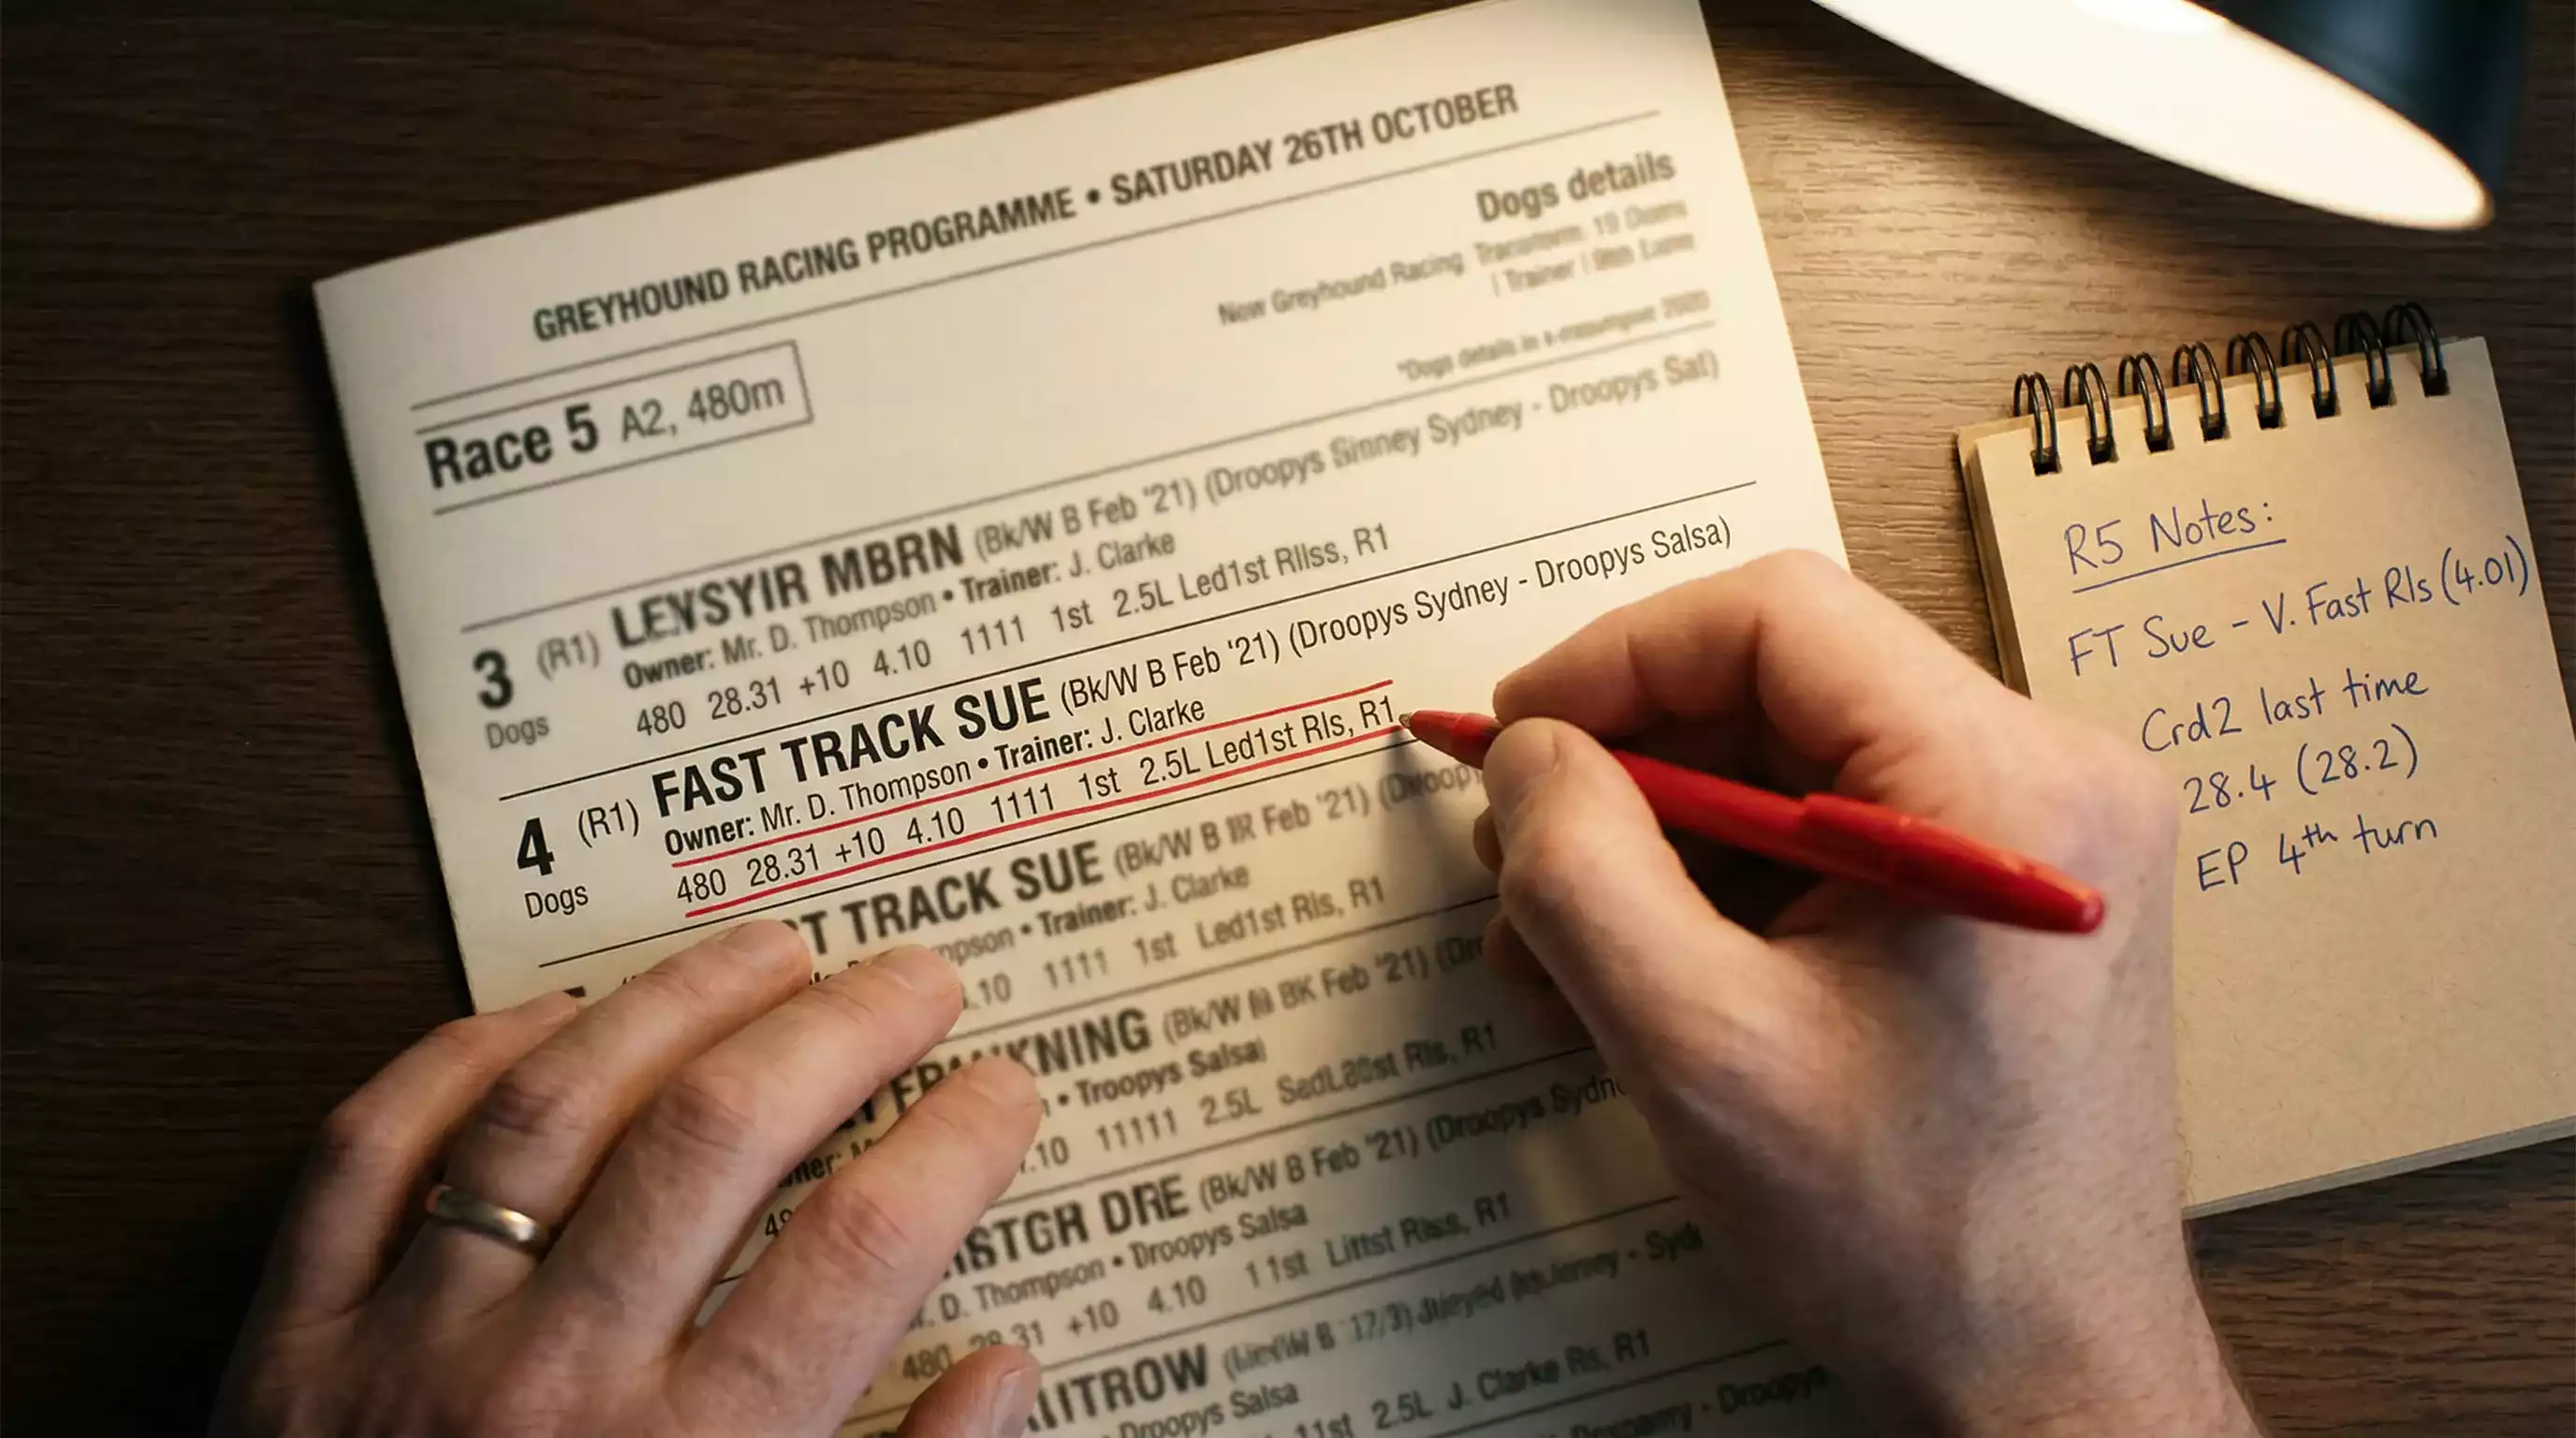
Time is the one metric a greyhound can’t fake. A dog can finish first because every other runner was crowded at the first bend, but it cannot clock a fast time without actually running fast. This makes time data the most objective element in Kinsley form analysis, and the section of the racecard that rewards the closest attention.
Sectional Times Versus Finishing Times
The finishing time tells you how long the entire race took. The sectional time — the split — tells you how quickly the dog reached the first timing point, typically the first bend. Both are useful. But at Kinsley, the sectional time is frequently the more important number, and here is why.
A fast sectional indicates early pace. Early pace at Kinsley correlates directly with a clean first bend, which correlates directly with an unimpeded run through the rest of the race. A dog that reaches the first bend in front avoids the crowding, bumping and checking that slows the runners behind it. Over 268 metres, where the race is decided in the first half of the circuit, the sectional time is practically the whole story. Over 462 metres, it remains the best single predictor of a clear run to the first two bends, even though the overall finishing time gains more relevance as the distance increases.
The mistake most punters make is comparing finishing times without adjusting for what happened during the race. Dog A finishes in 28.50 seconds. Dog B finishes in 28.70. Dog A looks faster. But if Dog A led from trap to line with a clear run while Dog B was bumped at the first bend, lost two lengths, and closed strongly down the home straight, Dog B may actually be the faster animal. Its finishing time was compromised by an event that cost it significant ground, and a clean run next time — perhaps from a better trap draw — could see it clock well under 28.50.
This is where race comments and sectional data work together. If Dog B’s sectional time was comparable to Dog A’s despite the first-bend trouble, that tells you it has the early pace to compete even from an impeded start. If its sectional was significantly slower, the first-bend trouble may have been a consequence of a slow break rather than bad luck, which changes the assessment. The sectional time provides the objective evidence; the race comment provides the narrative; together, they reveal more than either does alone.
Calculated and Adjusted Times
Raw finishing times at Kinsley are only meaningful in context. A time of 28.40 on a fast surface in dry conditions is not the same performance as 28.40 on heavy going after afternoon rain. The calculated time attempts to normalise for this by applying a going allowance — an adjustment that estimates what the dog would have run on a standard surface.
The going allowance is published by the track and varies from meeting to meeting based on the racing manager’s assessment of conditions. When the going is slow, the allowance reduces the raw time to produce a faster calculated time, reflecting the performance level rather than the clock reading. When the going is fast, the allowance may increase the raw time slightly, or the calculated time may match the actual time with no adjustment.
For form comparison purposes, always use calculated times when they are available. Comparing raw times across different meetings at Kinsley is unreliable because conditions vary significantly. A dog that ran 28.80 on a wet Wednesday and 28.50 on a dry Friday did not necessarily improve — it may have run at the same performance level with the going accounting for the entire difference. The calculated time strips out the going variable and gives you a like-for-like comparison.
There is a subtlety worth noting: the going allowance is an estimate, not an exact science. Different dogs respond differently to heavy or fast going, and the blanket adjustment applied to all runners on a given night may over-correct or under-correct for individual running styles. A front-runner that expends energy early may be more affected by heavy going than a patient closer, because the slower surface saps its initial burst. The going allowance does not distinguish between these running styles — it applies a single correction to the entire field. For the most precise form analysis, use the calculated time as a starting point and then apply your own judgement about whether a specific dog’s running style makes it more or less sensitive to the going on the night its time was recorded.
One further point: when a dog moves between tracks, its times at the previous venue are not directly comparable to Kinsley times. A 28.40 at Nottingham over a different distance on a different surface with a different hare is not the same as a 28.40 at Kinsley. Time comparisons are most reliable when they are same-track, same-distance, and adjusted for going. Cross-track comparisons are useful for broad-brush assessments of ability, but they should never be treated with the same confidence as within-track data.
Positional Form
Where a dog was at each bend matters almost as much as where it finished. Positional form is the layer of analysis that most casual punters skip entirely, but at Kinsley it frequently contains the information that separates a value bet from a losing one.
A standard Kinsley racecard or result will show you the finishing position. A detailed result will also show you positions at intermediate checkpoints — typically the first bend, the second bend, and sometimes the third or fourth bend on longer trips. These positional readings reveal the shape of a dog’s race in a way that the finishing position alone cannot. A dog recorded as 4-3-2-1 was fourth at the first bend, third at the second, second at the third, and won the race. That is a dog with a strong closing run. A dog recorded as 1-1-1-3 led until the final bend and was caught — a front-runner that lacks stamina for the full trip. Both dogs might show a “3” and a “1” in their form figures from different races, but their competitive profiles are completely different.
At Kinsley specifically, positional form at the first bend is the most critical checkpoint. The geometry of the track means that the first bend is where the majority of trouble occurs — crowding, bumping, checking, and positional scrambles that determine the running order for the rest of the race. A dog that consistently holds a top-two position at the first bend has a significantly higher probability of finishing in the frame than one that consistently runs fourth or fifth at that checkpoint, regardless of their respective finishing times from previous races.
The running-style codes on the racecard — rail, middle, wide — add another dimension to positional analysis. A dog that rails and holds second at the first bend is in a very different tactical position from one that runs wide and holds second. The railer has a shorter path through the upcoming bends and is less likely to be squeezed. The wide runner has covered more ground and faces a longer journey through every subsequent turn. Over four bends at 462 metres, that difference accumulates to the point where identical checkpoint positions can mask substantially different performance levels.
When building a form profile of a Kinsley runner, map its typical race shape. Does it lead early and sustain? Does it settle mid-pack and close? Does it consistently lose ground at the first bend and then make it up down the back straight? Each pattern has implications for different distances, trap draws, and race compositions. A dog that reliably closes from the back of the field is a stronger proposition when drawn outside in a race with several fast-breaking inside runners, because the early pace will create crowding that the closer avoids. A dog that leads is better drawn inside in a race without other early-pace runners, because it can establish position unchallenged. The positional data tells you the running style; the trap draw and field composition tell you whether that style is likely to be advantaged or disadvantaged in the specific race you are assessing.
Grade Context
A dog winning an A8 by six lengths isn’t impressive — unless it ran an A5 time while doing it. Grade context is the most frequently overlooked element in Kinsley form analysis, and the one that produces the most reliable value bets when applied correctly.
Every finishing position on a racecard was achieved in a specific grade. A first-place finish in A3 represents a far higher standard of performance than a first-place finish in A9, yet both appear as a “1” in the form figures. A punter who reads form figures without cross-referencing the grade of each race is comparing unlike with unlike — and making selection decisions on the basis of a fundamentally flawed comparison.
The grade column on the racecard exists for exactly this reason. For every dog in a race, check the grades of its recent runs. A dog with a form line of 3-4-5-2 looks mediocre. But if those results came in A3 and A4 races, and the dog is now entered in an A6, it is likely the fastest animal in the field by a comfortable margin. Its recent finishing positions were poor because it was racing against superior opposition. Drop it down two grades and it may win easily. The market will sometimes account for this, pricing the grade-drop runner as favourite. But at Kinsley, where the market is thinner and less sophisticated than at major metropolitan tracks, grade-drop runners frequently go off at longer odds than their form — properly interpreted — deserves.
The reverse scenario is equally important. A dog that has won its last three races may look like the obvious selection, but if those wins came in A8 and A9 and it has now been promoted to A6, it is stepping into a class it has never competed in. Its finishing times in A8 may not be fast enough to compete at A6, and its winning margins may have been achieved against slower dogs rather than through any special ability. Backing a dog on the strength of recent wins without checking whether those wins were at the same grade as the current race is one of the most common and most expensive mistakes in greyhound betting.
At Kinsley, where the grading system runs from A1 to A10, grade context is particularly rich. The ten grades create fine distinctions between ability levels, and a one-grade drop or rise represents a relatively small adjustment in the standard of opposition. This means that grade-drop runners at Kinsley are not always obviously better than the rest of the field — they may be fractionally faster, a difference that shows up in calculated times but not in dramatic winning margins. The punter who compares calculated times across the current field and identifies the dog whose best recent times came at a higher grade is doing the work that most bettors at this track are not.
Hidden Form Signals
The best bets at Kinsley are hidden behind bad-looking form lines that disguise genuine ability. This is where disciplined form analysis separates itself most clearly from casual racecard reading, because the signals that reveal value are embedded in the data rather than sitting on the surface.
Trouble in Running
A dog that finished fifth in its last race is not necessarily a weak dog. It may have been badly crowded at the first bend, lost three lengths, and still run a sectional time faster than the winner’s. The race comment might read BCrd1 — badly crowded at bend one — and the time data might show a calculated time within two-tenths of a second of the winner’s despite the interference. That dog was arguably the best runner in the race, and its fifth-place finish is misleading.
The discipline required is to read the race comments for every dog in the field, not just the one you are initially drawn to. Look specifically for trouble indicators: Crd (crowded), Bmp (bumped), BCrd (badly crowded), CrdRnUp (crowded and ran up), Ck (checked). Then cross-reference the trouble with the dog’s finishing position and time. If a dog was significantly impeded and still finished within striking distance of the winner, its next race — particularly if it draws a more favourable trap — may represent genuine value.
At Kinsley, where the first bend generates a disproportionate share of interference due to six dogs funnelling into a moderate curve, trouble in running is not a rare event. It happens in most races. The question is not whether a dog was troubled but how severely, and whether the market has fully adjusted for the impact. In the majority of cases, the market adjustment is incomplete. The fifth-place finisher gets a longer starting price next time, reflecting its poor result, even though the form data tells a story of an unlucky run rather than a lack of ability.
Rested Dogs and Season Returns
A gap in the form line — a period without a race — can signal several things, and misreading it costs punters money regularly at Kinsley. Dogs rest for various reasons: injury recovery, planned breaks, or in the case of bitches, seasonal absence. The form book does not distinguish between these causes, so the punter must look for contextual clues.
A bitch returning from a seasonal absence is one of the most reliable value indicators in greyhound racing. The GBGB requires bitches to be withdrawn from racing during their season, which produces a break of several weeks. In the period following their return, many bitches show a marked improvement in performance — faster times, more aggressive running, improved physical condition. This post-season bounce is well-documented among greyhound racing professionals but remains underpriced by the betting market at tracks like Kinsley where the form book is studied less intensively than at major venues.
The key indicators of a post-season return are a gap in the form line of roughly eight to twelve weeks, combined with a slight weight change and often a grade assignment that reflects the bitch’s pre-season form rather than her potential post-season ability. If a bitch was racing competitively in A5 before her break and returns graded at A6, she may be significantly underestimated. Her pre-season form alone would make her competitive at A6, and the post-season improvement could put her in a different class entirely.
Dogs returning from injury or rest are harder to assess because the pattern is less predictable. An injury layoff of several weeks may produce a dog that returns at full fitness or one that needs two or three races to regain race sharpness. The first run back is typically the most uncertain, and betting on it carries higher risk than waiting for the second or third outing, when the dog’s current level of ability becomes clearer. If you do bet on a dog’s first run back from a layoff at Kinsley, look for positive trial data — most trainers will trial a dog before re-entering it for a race, and word of strong trials occasionally filters through to the form community. But treat first-run-back bets as higher-variance propositions and stake accordingly.
Building Your Method
The method that works is the one you can apply consistently — not the one that sounds cleverest. A form analysis system that takes forty-five minutes per race and requires access to three databases is theoretically superior to a simpler one, but if you cannot sustain it across a full twelve-race card, week after week, it will produce worse results than a streamlined approach applied with discipline to every race.
A practical Kinsley form method can be built around four sequential checks. First, compare calculated times across the field at the relevant distance. Identify the dog or dogs with the fastest recent calculated times and note how those times compare to the field average. This takes two minutes and immediately flags the runners with the strongest pace credentials. Second, check the grade context. Were those fast times achieved at the same grade as today’s race, a higher grade, or a lower one? A fast time from a higher grade is more meaningful than the same time from a lower grade. Third, read the race comments from the last two or three runs for every dog. Look for trouble patterns, running-style tendencies, and any comment that suggests the finishing position was better or worse than the dog’s actual performance. Fourth, evaluate the trap draw relative to each dog’s running style and the composition of the field. A fast-breaking railer in trap one with no other inside-drawn pace rivals is a stronger proposition than the same dog in trap five behind two other early-pace runners.
This four-step process can be completed in five to eight minutes per race. Over a twelve-race card, that is roughly an hour to ninety minutes of preparation — a meaningful time investment, but one that fits within a normal evening and produces a structured assessment of every race rather than a scattergun collection of gut feelings. The output for each race should be one of three conclusions: a specific dog represents value at its probable odds; no dog offers clear value and the race should be passed; or the race is too uncertain to assess with confidence and should also be passed.
The critical habit is recording your conclusions and their outcomes. After a month of applying the same method to every meeting, review your records. Which of the four checks most often identified the winner? Which distances and grades produce your best results? Are there patterns in the races you passed that suggest you should have bet, or patterns in the races you bet on that suggest you should have passed? The method is not static — it improves as you accumulate data on its performance. But it can only improve if you apply it consistently and review it honestly.
Beyond the Form Book
Data gives you edges — but edges erode the moment everyone else spots them. Form analysis is a tool, and a powerful one. Applied with discipline at Kinsley, it will improve your hit rate, sharpen your selections, and reduce the number of bets you place on dogs that have no genuine chance. But it is not infallible, and the punter who treats it as a crystal ball is making an error as fundamental as the one who ignores it entirely.
Greyhound racing retains an irreducible element of unpredictability. Six dogs break from the traps simultaneously, and the interaction between them — who checks, who bumps, who gets a clear run — cannot be predicted from static form data. A dog with the best calculated time in the field, drawn perfectly, with grade context in its favour, can still finish last because it was knocked sideways at the first bend by a dog that stumbled out of the traps. That outcome is not a failure of analysis. It is the nature of the sport. The form book tells you probabilities. It does not promise certainties.
This is precisely what makes the discipline worthwhile. If every race at Kinsley could be predicted from the racecard, the odds would adjust to eliminate any edge, and profitable betting would be impossible. The unpredictability is what creates the gap between what the market prices and what actually happens — and the form analyst’s job is to identify the races where that gap is widest, bet accordingly, and accept the variance with equanimity.
The best punters at Kinsley share a particular temperament. They are rigorous with their data, disciplined with their staking, selective with their bets, and philosophical about their losses. They know that a losing run of six or eight bets does not invalidate their method if the method is sound. They know that a winning streak does not validate a bad approach if the wins were lucky. They measure their performance over months and seasons, not evenings and weeks. And they keep coming back to the form book — not because it has all the answers, but because it has more answers than anything else available.
Back up your analysis with sectional times in sectional times explained.
The form data at Kinsley will tell you more than most punters ever extract from it. But the final edge — the one that turns a decent analytical approach into a genuinely profitable one — comes from combining data discipline with the humility to admit what the data cannot know. That combination is rarer than it sounds, and it is worth pursuing.