Trap Statistics at Kinsley: Which Box Wins Most?
Numbers Behind the Starting Boxes
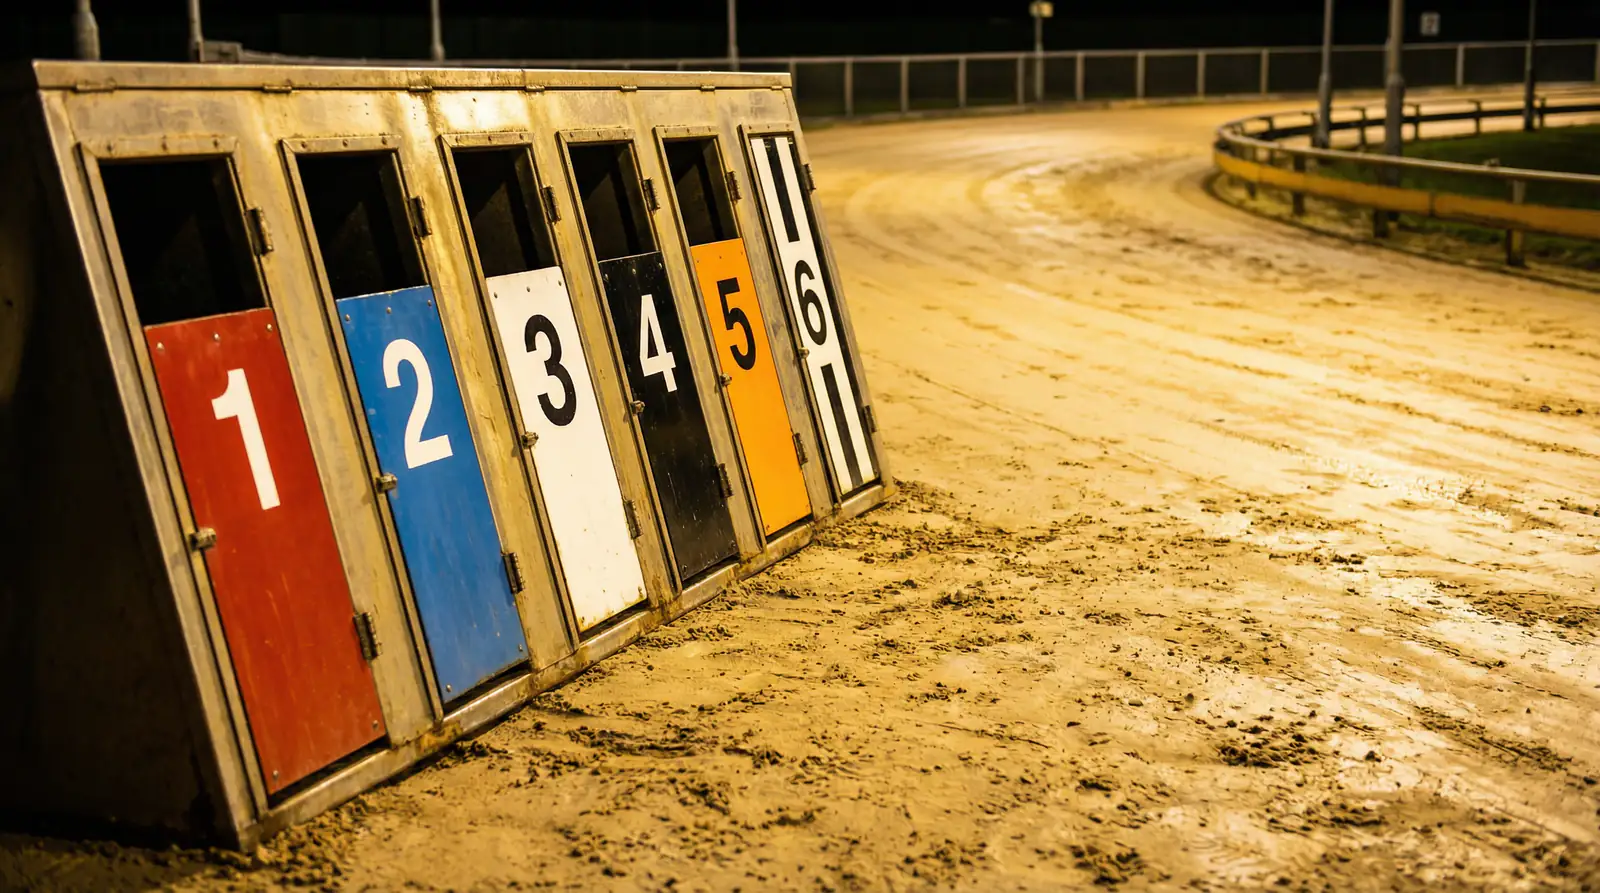
Every greyhound race at Kinsley starts from one of six traps. Each trap is assigned a colour — as defined in GBGB Rule 118: red for one, blue for two, white for three, black for four, orange for five, and black-and-white stripes for six — and the dogs wear a jacket matching their trap number. Before a race even begins, the trap draw has already influenced its probable outcome. Not every draw is equal, and understanding the statistical tendencies of each trap at Kinsley is a legitimate edge for anyone who bets on the dogs here.
Trap statistics are among the most accessible data points in greyhound racing. They do not require deep form knowledge or the ability to interpret sectional times. They are simple win-rate percentages calculated over a large number of races. But accessibility should not be confused with simplicity in application. Using trap data effectively requires context: which distance, which grade, which running style, and how the trap statistics interact with other form factors.
At Kinsley specifically, the trap biases are not extreme. This is not a track where one box dominates or another is almost hopeless. The advantages are marginal, measured in percentage points rather than dramatic disparities. But marginal advantages, applied consistently over hundreds of betting decisions, translate into material differences in long-term results. That is where trap statistics earn their place in a punter’s toolkit.
Analyse Kinsley trap statistics on the kinsleydogresults homepage.
How Trap Statistics Are Measured
Trap statistics are calculated by recording the finishing position of every runner from each trap over a defined period and expressing wins as a percentage of total starts. In a perfectly neutral scenario — where every trap has an exactly equal chance of winning — each box would win roughly 16.7 per cent of the time, since there are six runners in a standard UK greyhound race.
In practice, no track produces perfectly flat trap statistics. The geometry of the circuit, the position of the traps relative to the first bend, the hare’s running line, and the track’s surface all create small but consistent biases. At some venues, trap one wins 19 or 20 per cent of races while trap six wins only 13 or 14 per cent. At others, the distribution is nearly even. The specific numbers vary from track to track and from distance to distance.
The quality of the data depends on sample size. Trap statistics based on a full year of racing — thousands of races — are reliable. Statistics based on a single month or a handful of meetings are not. When consulting trap data for Kinsley, use the largest available sample.
One important caveat: trap statistics describe tendencies, not certainties. A trap that wins 18 per cent of the time is not going to win the next race just because it is statistically overdue. Each race is an independent event. The statistics tell you that, over many races, certain traps have a slight structural advantage. They do not predict the outcome of any individual contest. This distinction is crucial, and punters who forget it often misapply the data.
Trap Performance by Distance
Trap performance at Kinsley varies by distance, and the reasons for this are rooted in the track’s layout. Each racing distance starts from a different point on the circuit, which means the length of the run to the first bend changes depending on the trip. That run-up distance is the key variable affecting trap bias, because it determines how much time and space each dog has to find its position before the field converges on the first turn.
Over the 462-metre standard trip, the traps are positioned on the back straight with a reasonable run-up to the first bend. This gives all six dogs a fair chance to sort themselves out before the first turn, and the trap statistics over this distance tend to be relatively balanced. The inside traps — one and two — still show a marginal advantage in most season-long samples, but the edge is not large. The middle and outer traps are competitive, particularly when occupied by dogs with fast early pace or a wide running style that suits the outside draw.
At 268 metres — the sprint distance — the picture changes. The shorter run to the first bend compresses the field more quickly, and the inside traps gain a stronger advantage. Trap one, already on the rail, has the shortest distance to cover. Trap six has the longest. Over a full year of sprint results, the inside-trap bias tends to be more noticeable than it is over the standard trip. This does not mean outside draws cannot win sprints — they can and do — but the statistical gradient is steeper.
The staying distances — 650 and 844 metres — produce yet another pattern. These races involve more bends and more opportunities for position changes, which dilutes the initial advantage of the trap draw. A dog that breaks from trap six and sits wide through the first bend has five or seven more bends to work its way into a better position. The trap statistics for staying races at Kinsley tend to be flatter than for sprints or standard races, reflecting the reduced importance of the initial draw when the race involves multiple laps.
Grading level also matters. In higher grades, where the dogs are faster and the field quality is more uniform, trap bias tends to be less pronounced because every dog is competitive out of the boxes. In lower grades, where the variation in early pace is wider, the inside traps can gain a greater advantage because slower-breaking dogs from middle and outside boxes are more likely to get caught up in first-bend trouble.
Inside vs Outside: The Draw Debate
The inside-versus-outside debate in greyhound racing can be reduced to a single question: is the shorter path to the rail worth more than the cleaner air on the outside? The answer, at Kinsley and at most UK tracks, is that neither side holds an absolute advantage. It depends on the individual dog.
Inside traps benefit dogs that naturally seek the rail. A confirmed rail runner drawn in trap one at Kinsley is in its ideal position — it breaks, hugs the inside, and takes the shortest possible route around the circuit. The rail is always the shortest path around any bend, and over four bends that distance saving adds up to a meaningful advantage. Greyhounds designated as inside runners on the racecard — often indicated by comments showing them consistently in positions closest to the rail — perform best from the low-numbered traps.
Outside traps benefit dogs that run wide. A wide runner drawn in trap five or six can break cleanly, avoid the congestion that occurs on the inside through the first bend, and settle into its natural racing line without interference. For these dogs, being drawn on the outside is a positive, not a handicap. The extra ground covered is offset by the clean passage, and dogs that run wide tend to encounter less trouble in running — fewer crowding incidents, fewer checks, fewer lost lengths at the bends.
The problem arises when the draw contradicts the running style. A rail runner drawn in trap five has to cross the field to reach the inside, creating interference for other dogs and potentially getting caught in traffic. A wide runner drawn in trap one may find itself boxed in on the rail with no room to move to its preferred position. These mismatches are where the sharpest punters find their edge — not by blindly backing inside draws, but by identifying when a dog’s draw suits its running style and when it does not.
The racecard provides the data you need. Look at the comments from previous runs: does the dog consistently run close to the rail, or does it drift wide on the bends? Check the “W” (wide) and “M” (middle) designations. Then compare that information to the trap the dog has been drawn in for the current race. When the draw matches the running style, you have a positive factor. When it conflicts, you have a legitimate reason to mark the dog down in your assessment.
Using Trap Stats Without Overusing Them
The danger with trap statistics is treating them as a standalone selection method. Some punters build entire systems around trap bias — always backing trap one in sprints, for example, or systematically opposing trap six over 462 metres. These approaches occasionally show short-term profit, but over a larger sample they tend to converge toward the loss that the bookmaker’s margin guarantees for any mechanistic strategy.
Trap data is a factor, not a system. It should inform your selection alongside form, grade, running style, trainer, going conditions, and race comments. When a dog’s form points strongly in its favour and it also has a favourable trap draw, the statistical tailwind from the draw strengthens the case. When the form is marginal and the trap draw is poor, the statistical headwind gives you a reason to pass on the race.
The most productive use of trap statistics is as a tiebreaker. When your form analysis identifies two or three dogs with roughly equal chances in a race, the trap draw can separate them. The dog drawn in the trap that historically performs best at that distance, and whose running style suits that draw, gets the nod. This is not a dramatic edge. It is a marginal one. But greyhound betting is a game of marginal edges accumulated over time, and trap statistics, properly applied, are one of the more reliable margins available.
Factor in inside vs wide runners alongside stats in inside vs wide runners.
At Kinsley, where the favourite strike rate is low and the grading is compressed, every marginal edge counts. Trap statistics will not transform a losing punter into a winning one. But for someone who already does the form work, understands the grading system, and watches races with an analytical eye, trap data is the additional layer of information that can tip the balance from break-even to profitable over a season of betting.